Reconciling Paid Mining Income Against Your Own Records
Expected mining income is a formula, not an opinion: your hashrate divided by network hashrate, multiplied by 450 BTC of daily issuance, less the listed fee on the component being settled. At the read-date network hashrate of 1,003 EH/s, a 500 TH/s fleet therefore expects about 0.0002243 BTC a day — roughly $19.00 at $84,692 per BTC — and any month that lands more than a percent or two away from that figure has a cause worth finding.

Key takeaways
- The expectation line is hashrate ÷ network hashrate × 450 BTC × (1 − listed fee). Everything else in a reconciliation is a variance explanation.
- At 500 TH/s the daily figure is about 0.0002243 BTC, or $19.00; a 30-day month expects roughly 0.00673 BTC gross and 0.00646 BTC after the listed 4% fee on the block-reward component.
- Payment cadence changes when you record income, not how much of it exists: PPS+ settles hourly against current difficulty, while PPLNS distributes after 6 confirmations over a trailing 5 difficulty-round window.
- A steady 3% of lost effective hashrate is about $17 a month at this scale — the single most common explanation for a gap that is too small to chase and too large to ignore.
Why the numbers move
Mining income varies for four reasons, and a reconciliation is only useful if it separates them. The first is network difficulty, which changes the value of every share; the −2.12% estimate on the read date is worth roughly +2.2% per share if it lands. The second is your effective hashrate, which is your nominal hashrate minus throttling, stale shares and downtime. The third is the settlement rule, which decides the hour or day a given share becomes cash. The fourth is the fee schedule, applied to the component being settled.[1]
Only the second and fourth are under your control, and only the second is usually material. That is why a reconciliation should always start with an effective-hashrate figure for the period, taken from the pool's worker view rather than from the machine labels.
What changes your payout
The payment method determines the shape of the mismatch between your records and your banked balance. PPS+ settles the block-reward component per share at current difficulty with a listed 4% fee and pays hourly, so a monthly total is simply the sum of roughly 720 hourly credits. PPLNS applies a listed 2% fee to block rewards and transaction fees together but only distributes when the pool finds a block, after 6 confirmations, weighted over the last 5 difficulty rounds.
| Line | How to compute it | Common cause of a difference |
|---|---|---|
| Expected BTC, gross | Your hashrate ÷ network hashrate × 450 BTC, over the period | Using an average network hashrate from the wrong week |
| Expected BTC, net | Apply the listed fee to the component it actually applies to | Treating a 4% component fee as a flat 4% haircut on all income |
| Credited BTC | Sum of settlement records for the period | Settlement timing: an hour or a confirmation window falling outside the period |
| Effective hashrate | Credited shares converted back to hashrate | Throttling, stale shares, or one worker offline for part of the period |
| USD value | BTC credited × one price, read at a fixed hour | Valuing different settlements at different prices |
| Variance | Credited BTC minus expected BTC, net | If under 1% for the period, the records are working |
Two habits make this table hold. First, fix the reading hour for the price, so the USD column measures mining performance rather than market movement. Second, record the difficulty in force at the start and the end of the period: without it, a difficulty adjustment inside the month looks exactly like a hashrate fault.
Worked example
Take a 500 TH/s fleet over a 30-day month. Network hashrate is 1,003 EH/s and daily issuance is 450 BTC, so the gross expectation is 0.00673 BTC, about $569.90, and after the listed 4% fee on the block-reward component the net expectation is roughly 0.00646 BTC, or $547.
Now subtract the physical cost of running it. At 20 J/TH, 500 TH/s draws 10 kW, which is 240 kWh a day and $14.40 at $0.06 per kWh — about $432 for the month. Net of power, the month leaves roughly $115 at the read-date price, before hosting, cooling or capital costs.
Then look for the drift. A 3% stale-share rate costs about 3% of the gross figure, roughly $17 a month at this scale, and it appears in the records as a hashrate slightly below nominal with shares still being submitted. A single machine offline for two days costs about $1.90 a day for as long as it is down — small on its own, decisive across a fleet.
The same arithmetic explains why larger fleets reconcile more easily. At 20 PH/s the daily gross is 0.00897 BTC, about $759.87, and 0.05 BTC of expected income accumulates in about 5.6 days. At 50 TH/s, a 0.05 BTC target is a 2,229-day project, so the meaningful comparison is monthly net income against electricity rather than against a BTC target.
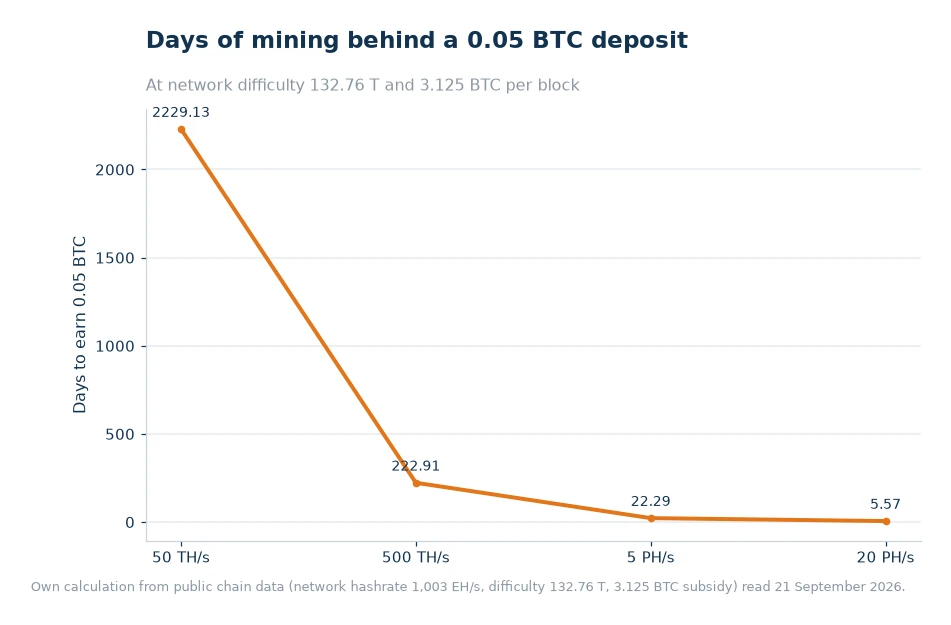
Use a mining statistics page for the network side of the equation and your own settlement records for the credited side, and the variance column becomes a single number. If that number is persistently negative, the honest next step is not to blame the pool but to convert credited shares back into hashrate and compare it with the fleet's nominal figure.
What to check monthly
- Effective versus nominal hashrate. The gap is your variance budget; anything above about 2% deserves a worker-by-worker read.
- The fee as components, not a headline. The listed 4% applies to the PPS-settled block reward and 2% to the PPLNS-distributed components, so a single blended percentage will never match settlements.[2]
- Settlement boundary overlap. Count the credits, not the days: an hourly PPS+ month has roughly 720 settlements, and a missing one is arithmetic rather than theft.
- Difficulty at both ends of the period. Recording the opening and closing values makes an adjustment inside the month visible instead of confusing.
- Machine-level profitability. A miner profitability ranking is the fastest way to identify which models should be retired rather than repaired when the variance points at hardware.
- Where the coins landed. Confirm the credited balance reached the account you expected, and that any conversion between assets happened at the time you think it did.
Every input on the credited side of the reconciliation is visible per worker, per coin and per hour on the ViaBTC BTC Mining Pool statistics view, which is what makes a monthly checkpoint a twenty-minute job rather than an investigation.
Frequently asked questions
Can I mine more than one coin at the same time?
Yes. Merged mining lets a machine secure a parent chain and an auxiliary chain together, and multi-coin pools support switching between chains without moving hardware.
Do mining pools cost anything to join?
Joining is free; the pool earns from its fee on settled payouts, which appears as a percentage of the block-reward and transaction-fee components.
How do I calculate expected mining income?
Divide your hashrate by network hashrate, multiply by the 450 BTC the network issues per day, then apply the listed fee to the component being settled. Compare that figure with the credits in your records for the same period.
Why is paid income lower than the calculator estimate?
The usual causes are effective hashrate below nominal, a fee applied to a different component than you assumed, settlement falling outside the period you measured, or use of an average network hashrate from the wrong week.
The short version
Write the formula down, compute the expectation for the period, and subtract what was credited. If the gap is under a percent, the records are sound. If it is larger, check effective hashrate first, settlement boundaries second, and the fee components third — in that order, because that is roughly the order of how often each one is the answer. Do it monthly and a bad quarter becomes impossible.
Data and sources: ViaBTC fee schedule and payout documentation[1] and ViaBTC pool statistics[3]. Network hashrate, difficulty, subsidy and BTC price read from public chain data on 21 September 2026. Figures are illustrative and change with difficulty and price.